
Home / Reports / Inventory Quality Report 2026

Defining quality in an AI-disrupted internet.

AI has made low-quality supply nearly free to produce. Picnic's annual Inventory Quality Report shows what's actually happening to open-web inventory — and how advertisers can protect ad spend.

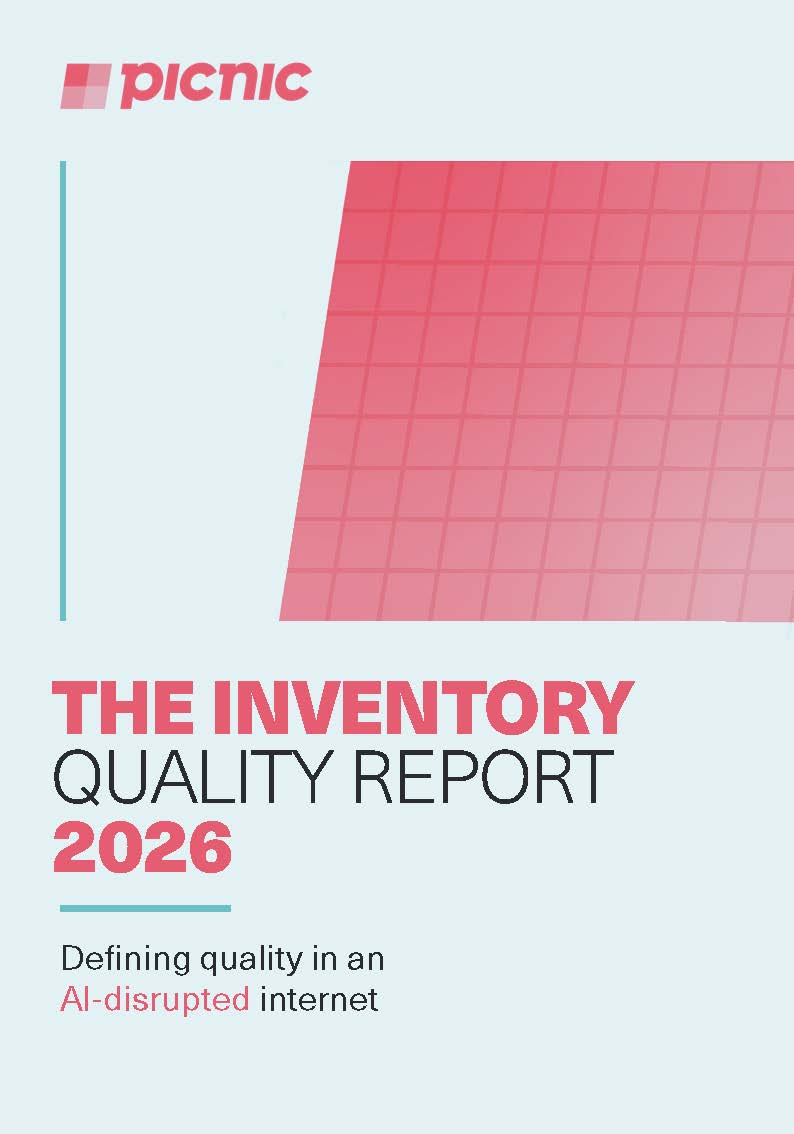
The Inventory Quality Report 2026 cover

Get the free report.

Two quick details and we'll open the report in a new tab.

Please enter your first name.
Please enter your last name.
Please enter a valid work email.

By submitting, you agree to Picnic emailing you the report and related insights. Unsubscribe anytime.

0K domains scored by PIQ in 2026, up 300% on 2024.
0+ quality signals measured per domain.
0% of domains fall below PIQ's quality threshold.
0× more consented sessions on high-quality inventory.
From the founder

"Quality isn't invisible. It's measurable."

AI didn't create the open web's quality problem — it made it cheaper to scale. The industry has accumulated metrics — viewability, brand safety, domain authority — but none were designed to measure quality holistically. Buyers have been filtering out some risk while missing the majority of high-quality inventory. That's where spend and performance are being lost.

Matthew Goldhill, CEO & Founder of Picnic
Matthew Goldhill CEO & Founder, Picnic
Inside the report

Five sections, one argument.

01 The state of inventory quality: 2024–2026 Two years of PIQ data: how 1 in 3 failing domains became 44.4%, and the structural gap hiding in advertiser sitelists.
02 The three challenges redefining quality AI slop, signal washing and framework overload — and why they need more than incremental fixes.
03 The PIQ Platform & the PIQ10 2026 How signal-led curation removes ad waste — plus this year's ten highest-scoring open-web domains.
04 How PIQ measures inventory quality The four-step methodology, the two core indexes, and the 100+ signals behind every score.
05 Zoom-in, zoom-out: traffic quality in practice The Elida Beauty case study and the cross-industry pattern that held across three verticals.
The three forces

Three forces reshaping the open web.

Individually, each is a distinct challenge. Together, they're changing how value is created and lost in programmatic.

Challenge 01

AI vs the open internet

AI didn't create the quality problem — it made low-quality production almost free. Professionally-produced content farms now absorb ad spend at industrial scale: websites funded by advertisers, yet rarely visited by humans.

717% rise in AI slop sites since GenAI went mainstream — ~10,000 new sites a month.

Challenge 02

Signal washing

Applied in isolation or reduced to single thresholds, signals create the appearance of quality while masking how it's defined. Synthetic sites clear brand-safety and keyword checks unscathed — visible scores, not explainable ones.

25–30% of programmatic spend lands in wasteful or low-quality environments.
Challenge 03

Framework overload & buyer reliance

When quality assessment, buying and optimisation all sit in one platform, advertisers are asked to trust one system to define what "good" looks like — with no way to interrogate or adapt that definition.

90% of high-quality domains are absent from typical advertiser sitelists.
The PIQ10 · 2026

The domains delivering quality for advertisers.

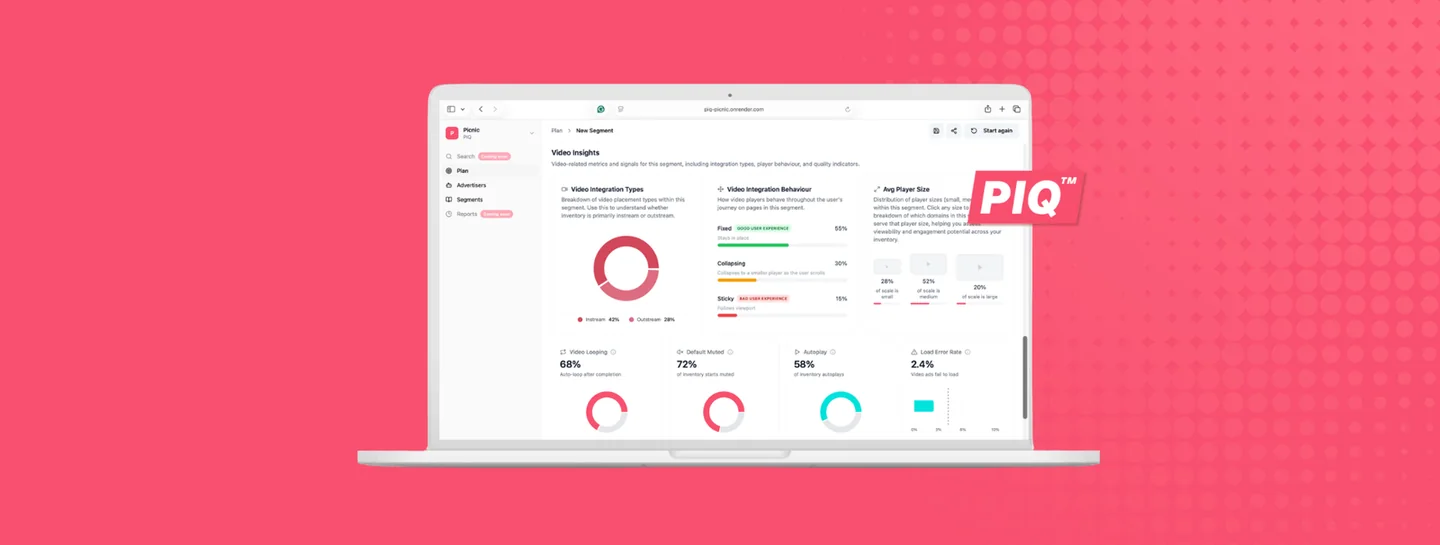
PIQ analyses 100+ quality signals — ad density, ad refresh rates, video-player behaviour — and combines them into a single score from 0–100. Scores above 50 are High Quality; anything below 30 is Low Quality.

0 Low Quality MFA traits: high ad density, fast refresh, autoplay video. Below the 30 threshold.
0 Premium Quality Non-disruptive ad experience, reputable publisher profile, strong domain authority.
Rank Domain PIQ Score
01techcrunch.com96.77
02nationalgeographic.com87.96
03nature.com82.97
04engadget.com78.51
05politico.com76.34
06theguardian.com75.60
07lonelyplanet.com73.27
08healthline.com69.30
09drugs.com66.85
10newscientist.com64.42
Rankings reflect UK traffic only and include domains without a paywall. PIQ scores update continuously as page experiences evolve and may differ slightly from those shown here. The full top-10 and year-on-year movement are in the report.

Make each impression
count.

The Inventory Quality Report shows where programmatic spend is being wasted, which signals to trust, and how to build a higher-quality inventory strategy.

Download the report

More Picnic insights.

All articles